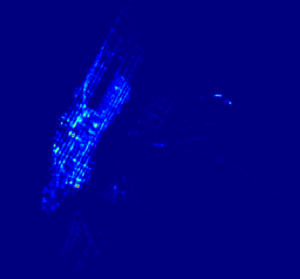
This analysis will use the NYC taxi cab trips data to compute density rasters.
The data can be obtained here.
Each record is in the following structure,
medallion,hack_license,vendor_id,rate_code,store_and_fwd_flag,pickup_datetime,

pickup_latitude,dropoff_longitude,dropoff_latitude
Data columns for interest are taxi id(medallion), pickup/dropoff datetime, pickup/dropoff longitude/latitude, trip_time and trip_distance.
Sample trip:
AECF13C3F540D4CF4,BA96DE419E711691B9445D6A6307C170,CMT,1,N,2013-01-01 15:11:48,2013-01-01 15:18:10,4,382,1.00,-73.978165,40.757977,-73.989838,40.751171
1. Data representation
The raster data format is used to represent continuous phenomenon such as temperature and precipitation.
More information about raster data format can be found here. To generate a density raster following information is needed,
- a. bounding box of the area/raster (xmin, ymin, xmax, ymax)
- b. cell width, height
- c. spatial reference
Using this information number of rows and columns of the raster can be determined using following formula,
rows = ymax - ymin/cell_size

     cols = xmax - xmin/cell_size
2. Data parsing
- a. Parse the taxi record and calculate row, column for the taxi pickup longitude/latitude using following formula,
col = trip_pickup_longitude - xmin /cell_size

row = trip_pickup_latitude - ymax / cell_size - b. Parse the taxi trip pickup datetime to generate yyyyMMddHH, so that we can aggregate by hour later
- c. Generate following tuple for each taxi record,
((row, col, yyyyMMddHH),1)
Here is the parse code, similar to my other post that calculates average daily speed of a taxi.
raw_data_input = sc.textFile("/spark/nyc-taxi/data/trip_data_test_1.csv")

trips = raw_data_input.map(ingest_record)

def ingest_record(record):

"""

Args:

record (str) - taxi record

Returns

((int, int, str), int) - ((row, col, yyyyMMddHH), 1)

"""

(medallion, hack_license, vendor_id, rate_code, store_and_fwd_flag,

pickup_datetime, dropoff_datetime, passenger_count, trip_time_in_secs,

trip_distance, pickup_longitude, pickup_latitude, dropoff_longitude,

dropoff_latitude) = record.split(',')

pickup_date, pickup_time = pickup_datetime.strip().split()

pickup_year, pickup_month, pickup_day = pickup_date.split(‘-‘)

pickup_hour, pickup_minute, _ = pickup_time.split(‘:’)

row, col = get_row_col(pickup_datetime)

yyyyMMddHH= “{pickup_year}{pickup_month:02d}{pickup_day:02d}{pickup_hour:02d}”.format(

pickup_year=int(pickup_year), pickup_month=int(pickup_month), pickup_day=int(pickup_day),

pickup_hour=int(pickup_hour))

return ((row, col, yyyyMMddHH), 1)
3. Aggregate
In this step well we will create an hourly aggregation of taxi trips using reduceByKey
trips.reduceByKey(sum)
The result of hourly aggregation is RDD with following elements:
[((162, 616, '2013011309'), 2), ((771, 209, '2013011316'), 1), ((361, 911, '2013011317'), 1), ((343, 921, '2013011317'), 1), ((253, 830, '2013011313'), 2), ((60, 662, '2013011305'), 1), ((78, 463, '2013011311'), 1), ((82, 590, '2013011312'), 1), ((87, 587, '2013011312'), 1), ((90, 555, '2013011311'), 1)]
4. Create raster from trips
Results from aggregation is of following format: ((row, col, yyyyMMddHH), aggr_val)
To create a raster,
- Generate tuple to aggregate by yyyyMMddHH -> (yyyyMMddHH, (row, col, aggr_val))
- Create a numpy 2d array (dimension nrows x ncols – 800X800 in our example) where each element represents aggregation value.
Output of this step,
[('2013010102', array([[ 0.,  0.,  0., ...,  0.,  0.,  0.],

       [ 0.,  0.,  0., ...,  0.,  0.,  0.],

       [ 0.,  0.,  0., ...,  0.,  0.,  0.],

       ...,

       [ 0.,  0.,  0., ...,  0.,  0.,  0.],

       [ 0.,  0.,  0., ...,  0.,  0.,  0.],

       [ 0.,  0.,  0., ...,  0.,  0.,  0.]], dtype=float32)),

('2013010103', array([[ 0.,  0.,  0., ...,  0.,  0.,  0.],

       [ 0.,  0.,  0., ...,  0.,  0.,  0.],

       [ 0.,  0.,  0., ...,  0.,  0.,  0.],

       ...,

       [ 0.,  0.,  0., ...,  0.,  0.,  0.],

       [ 0.,  0.,  0., ...,  0.,  0.,  0.],

       [ 0.,  0.,  0., ...,  0.,  0.,  0.]], dtype=float32)),
5. Plot the density map
Use the matplot to plot the density.
1-hr density

4hr density
